Update, after the presentation on Darien performance in state tests:
Darien school testing results were a mixed bag this year, with middle school students scoring extremely high and students in the elementary and high schools tending to score low or middling compared to similar districts.
Superintendent of Schools Dan Brenner indicated he was skeptical that the wide disparity in scores for the different grades was something more than an anomaly in some of the tests — one of the tests, the “Smarter Balanced Assessment,” was given statewide for the first time this year.
In the CAPT test given to 10th graders, Darien scored lower than other school districts in the “District Reference Group A” that the state set up to help with comparisons of school districts. In the Smarter Balanced Assessment test given to 11th graders, Darien’s score was second-lowest among comparable school districts. Elementary school test takers scored in the middle of the pack for most tests.
Board of Education member Kathrine Stein asked district officials whether the Smarter Balanced Assessment test would be used in placing students in advanced or other classes in the future.
“We don’t know a lot about the validity and reliability of this [Smarter Balanced Assessment] test,” Brenner told the Board of Education at Monday night’s meeting.
“I would caution any one piece of data being used in that way,” said Dr. Susie Da Silva, assistant superintendent of curriculum and instruction. Instead, it may be taken into account along with other tests, grades and factors, she said.
Da Silva, who gave the presentation with the slides (included with this article, below), largely stuck to what was said in the slides as she spoke. She repeatedly emphasized that many factors go into evaluating students, including individual circumstances such as whether a student was sick when the test was given.
She even cautioned against comparing Darien’s performance with other school districts because districts may have administered the tests in different ways and at different times.
Darien had a rather high proportion of its students taking the Smarter Balanced Assessment test, compared with some other school districts, officials said.
Out of 331 high school students last spring, 294 started testing over the course of days when the test was given, and 284 completed the “English Language Arts” part of the test, said Marc Marin, director of instructional technology. For the math part of the test, 267 students started taking the test and 254 completed it.
In Darien, the math part of the test was taken after the “English Language Arts” part, and across the state at the time, as the tests were being taken, more students were dropping out of them as parents and students became concerned about overtesting.
Participation was even higher at the elementary school and middle school level, Marin said with 98 to 100 percent participation, depending on the grade level. For Grade 5 students, there was 100 percent participation.
Original article, published Monday, before that night’s presentation
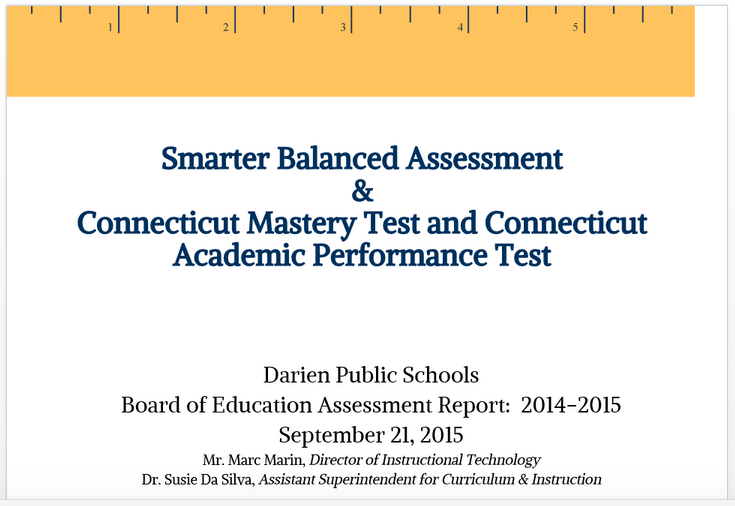
Many of the state test results for Darien schools were lower than those of comparable school districts, but others were higher, according to these slides for a presentation Monday night by Darien school district officials on the district’s scores.
(Darienite.com will cover the meeting, which is open to the public and starts at 7:30 p.m. in the Board of Education meeting room at Darien Public Schools headquarters, 35 Leroy Ave. The presentation is expected to start at 8:15 p.m. The meeting won’t be covered live by Darien TV79, but you can watch it Tuesday starting at 7:30 p.m.)
In the “Smarter Balanced Assessment Tests,” a new state test that replaces the older Connecticut Mastery Test (CMT) and Connecticut Academic Performance Test (CAPT), there’s nothing to compare the results to (since this is the first year of the tests) other than state expectations and to average scores of students in school districts similar to Darien.
For many comparisons of school districts, the state has set up “DRGs” (District Reference Groups) for districts of similar sizes and demographics. DRG A includes Darien, New Canaan, Wilton, Weston, Westport, Ridgefield, Redding and Easton. (Redding and Easton are in a combined high school district.)
Differences in scores sometimes were by only a few percentage points, sometimes by more. Here’s what the slide presentation shows on how Darien compared:
- Darien students did worse than students in similar school districts in Grade 11 math (with only 58.9 percent meeting or exceeding state expectations, Darien was at the bottom of the list, which included the highest score from Ridgefield at 70.9 percent, followed by New Canaan at 68.7 percent; no other district scored below 60 percent).
- Darien students scored better than students in other DRG A districts in Grade 3 math, and achieved higher scores, on average, than students in any other district in English and math tests for Grades 6, 7 and 8.
- Darien students came out in the middle of the pack in Grade 3 English, Grade 4 English and math, Grade 5 English and math.
For the Connecticut Mastery Test (Grades 5 and 8) and the CAPT (Grade 10), the slide presentation shows these results:
- Grade 5 — 79.9 percent at the state goal or higher — fifth best among eight districts in DRG A, with Weston at 90.2 percent and New Canaan No. 2 at 86.8 percent.
- Grade 8 — 92.3 percent at the state goal or higher — tops among all DRG A school districts, with New Canaan next highest at 90.1 percent.
- Grade 10 — 74.6 percent at the state goal or higher — second lowest among all DRG A school districts, with only Weston lower (by a 10th of a point) at 74.5 percent. The highest scoring district was New Canaan, at 87.1 percent.
Here’s the slide presentation:


