

As of Thursday, April 2, the number of known cases of COVID-19 in Darien jumped from 77 to 91, an increase of 17 (or 18% over the previous day), according to a chart published Friday on the town government website.
The chart, showing the daily number of positive COVID-19 test results, is one of a series presented on a web page on the town website. Other charts on the page show the distribution of Darien COVID-19 cases by gender, age group and age group over time.
The hefty increase in the number of Darien cases is only in the number of known COVID-19 cases in town, not the actual number of cases (which is unknown), and it doesn’t come with an explanation of what factors might have resulted in the jump, such as possible delayed testing results from previous days or increased testing as more opportunities have become available to get a test.
In an interview Friday afternoon, Darien Health Director David Knauf was asked about those possible reasons for the jump in the case number and agreed that those factors are both possibilities. The rise in Darien COVID-19 case numbers “probably have more to do with the fact that more people are being tested,” Health Director David Knauf said Friday afternoon.
- UPDATE, 5:31 p.m., Friday: The state Web page for testing results said a jump in the overall state COVID-19 test results reflects a catchup in data gathering, and “This increase does not reflect a change in the trajectory of the outbreak.”:
- “As of April 3, 2020, a total of 4914 laboratory-confirmed cases of COVID-19 have been reported among Connecticut residents (Figure 1). Nine hundred and nine patients are currently hospitalized. One hundred and thirty-one residents have died. The increase in cases reported today is related to catch up of data entry and implementation of a new method for reporting cases to the Department of Public Health. This increase does not reflect a change in the trajectory of the outbreak.”
Knauf said he doesn’t have day-to-day information on the total number of people from Darien who get tested, getting either a positive or negative result for the presence of the COVID-19 virus.
Knauf said that if he could compare positive results with the total number tested, that would give some indication of whether the spread of the virus is speeding up, staying steady or slowing down, leading to a “flattening of the curve” that could result in hospitals avoiding being overwhelmed by a spike in cases.
Overall, Knauf said, information from Murphy Medical, the company doing testing at the Darien High School campus, indicates 10% to 15% of the tested in Darien test positive, but Knauf doesn’t have an indication of what changes may be taking place in that percentage, or similar data on COVID-19 tests done elsewhere of Darien residents.
The data in the charts represents people who test positive for COVID-19 and who are Darien residents, no matter where they’re tested, Knauf said.
The charts, which are labeled with the caveat “Data is preliminary and subject to change,” are published in this article, below.
Knauf said he hopes Darien residents who see the chart will be more likely to practice social distancing.
“I don’t think enough people are staying home,” he said. “People need to stay home. People need to socially distance themselves. I can’t overstate the importance of that.”
In addition to publishing the charts on Friday, the town website’s COVID-19 information is now available from a link in a red band at the top of the website home page.
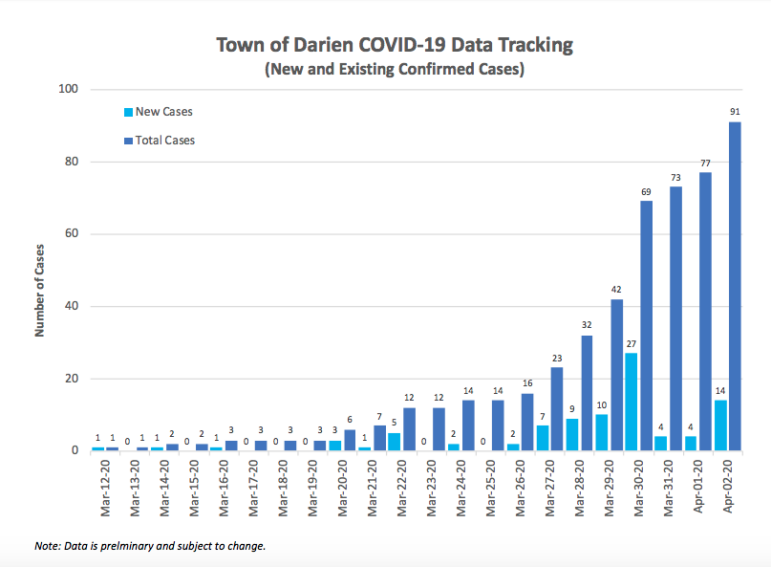
Image from the town government website
The chart very roughly resembles an exponential growth curve, meaning more growth over time. In detail, the number of new cases has jumped up and down, but the overall trend is exponential growth.
The jump in cases on Thursday was not the largest increase in Darien COVID-19 positive results — on March 29, the number jumped by 27 — from 42 to 69 (a jump of 64%). In contrast, the next two days showed increases of only four cases a day.
Overall, the chart for Darien’s total number of cases looks roughly like exponential growth (a faster rate of growth over time) since March 20, when Darien had one identified case. The numbers of new cases, however, don’t show much of a pattern except a gradual increase over time.

Slightly more Darien women than men have tested positive for COVID-19, although that could be a result of more women being tested. This is consistent with statewide results, where the number of women who have tested positive (1,971) also is larger than the number of men (1,839).

Image from town government website
Darien Confirmed cases by age group as of April 2, 2020.

Image from town government website
From the state government website: Confirmed COVID-19 cases by age group IN CONNECTICUT, as of April 2, 2020. As in Darien, the group for ages 50 to 59 has the largest number, and the oldest group has fewer identified cases than the group of those in their 20s.

Darien COVID-19 cases by age group over time as of April 2, 2020.
______________________
SIDEBAR:
FRIDAY State Results: COVID-19 Cases in Lower Fairfield County
This sidebar is taken from an update of the article LATEST DARIEN COVID-19 NEWS: Continual Updates: March 30 to April 5.
As of Friday, 77 Darienites (14 more than the day before) have been identified with COVID-19, according to information released by state authorities. (Reminders: Many people are thought to have the COVID-19 virus who aren’t identified; the state says “all figures are preliminary and subject to change.”)
Here’s the number of identified cases in nearby communities, according to the state government Coronavirus statistics updates Web page:
Stamford — 508 (71 more than the day before) (highest number in CT)
Norwalk — 435 (105 more than the day before) (second highest in CT)
New Canaan — 61 (10 more than the day before)
Greenwich — 189 (19 more than yesterday) (fourth highest number in CT — Danbury is third)
Westport — 134 (nine more than the day before) (sixth highest in CT — New Haven is fifth)
Wilton — 71 (20 more than the day before)
Weston — 32 (three more than the day before)
Ridgefield — 88 (10 more than the day before)
Fairfield — 62 (11 more than the day before)
Bridgeport — 115 (10 more than the day before)
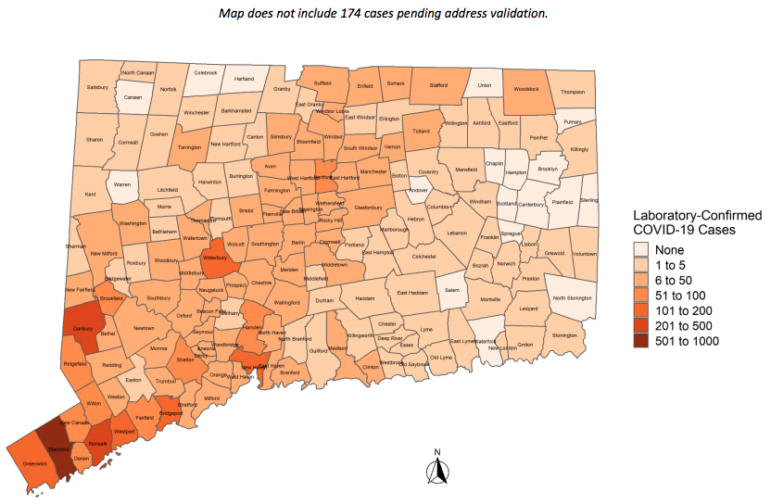
Image from state government website
For Friday, April 3, 2020

Image from the state government website
Closer view of hte map just above, showing southwestern Connecticut towns, comparing known COVID-29 cases