

Before you go out this week and decide to buy back-to-school clothes or other clothing, consider how much of that clothing will actually be worn.
According to a survey in 20 countries, the vast majority of items will hang around in your closet or sit in your drawers for a year or more without being worn.

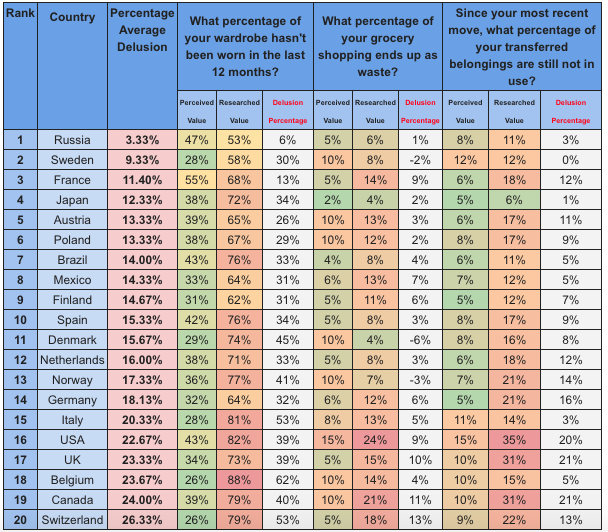
Table from Movinga
Americans don’t (or hardly ever) use four fifths of the clothing we buy, and we’re among the worst in the world on that score. Also: the overall “delusion” gap for what we think we don’t use after buying clothing, food or after moving (see other tables for the rest).
Back-to-school clothes worn by growing kids may be an important exception (since kids do grow out of their clothing), so adults should be thinking about their own clothing purchases.
In the last 12 months, 82 percent of the clothing Americans had previously bought and still have has not been used, according to an international study. Also, 24 percent of the food Americans buy ends up not being eaten.
And we don’t realize that the waste is this high, according to a study released by a German moving and relocation company, Movinga.
For the new study, researchers surveyed Americans and residents of 19 other countries to compare how much they think they don’t use with what was measured in a previous study of what consumers don’t use.
Americans weren’t the worst in most comparisons, although we waste more food than any of the other countries surveyed. Canada is the next worst, at 21 percent; in third place is Switzerland, at 18 percent. Americans who were surveyed said they thought they wasted only 15 percent of what food they bought.
_____________
Other back-to-school-related stories:
- From Now Till Darien’s First Day of School, Events for Teachers and New Students (Aug. 22)
- Darien Police Advice to Teens, Parents on Driving to and from School — Safely (Aug. 21)
- CT Sales Tax Free Week Coming Aug 19 to 25: What to Know (Aug. 17)
- Get Your Kids Involved in Back-to-School Shopping: Some Teachable-Moment Tips (Aug. 17)
- How to Protect Your Children’s Privacy as They Head Back to School (Aug. 20)
- How Darien Police Are Working with Schools in Town to Protect Students (July 30)
- Appeals for Donated School Supplies: […]Darien Human Services’ Runs Aug 13 to 30 (July 27)
_____________
When asked, “Since your most recent move, what percentage of your transferred belongings are still not in use?” Americans thought the amount was 15 percent. But the earlier survey said the unused portion is actually more than a third — 35 percent (Canada and the United Kingdom were tied for second place, with 31 percent).
One Thing You Can Do
Here’s some advice from the “Apartment Therapy” website for figuring out which clothes you might want to get rid of. It describes an old trick (sometimes called the “reverse hanger trick”) that also can be found in several other places on the Web: (one suggestion is to review the results six months later, so mark your calendar):
- “[A]fter you wear each item, turn the empty hangers around when you put your clothes back in the closet after washing. You’ll soon see what you wear a lot, and what you never touch! It’s a great way to make things obvious, which will help when it comes time to give your clutter a long hard look.”
Here’s part of a news release from Movinga, with a table showing detailed results from surveys:
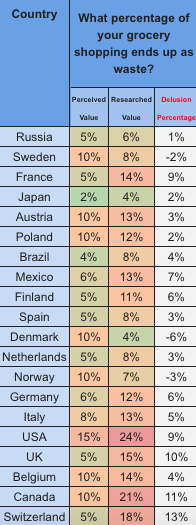
Table from Movinga
According to the study: What food we think we waste, what we do waste and the gap between perception and reality. (For the full table, see below.)
Formed as part of a larger study on relocation trends to be released later this year, Movinga conducted a poll among 18,000 heads of households in 20 countries comparing individual’s perception on how much they own versus how much they actually use, to reveal the level of cognitive dissonance we live in.
The results reveal that individuals are unable to perceive their own part in the global issues we face in terms of over-consumption and waste generation. Movinga hopes that this study can raise consciousness and spark a discussion on how we as individuals can do our part to help reduce wastage.
“At Movinga, we are personally invested in ways to make the moving process more effective and less stressful for our customers, however we are becoming increasingly aware of our responsibility towards the world we live in”, says Finn Age Hänsel, Managing Director at Movinga.
“With the oceans becoming ever more polluted with plastic, and the fast fashion industry bigger than ever, it’s time to start encouraging individuals to reconsider whether they really need more stuff.”
- Methodology: We first polled 18,000 heads of households in 20 countries with the following questions: What percentage of your wardrobe hasn’t been worn in the last 12 months?; What percentage of your grocery shopping ends up as waste?; Since your most recent move, what percentage of your transferred belongings are still not in use? We then collated the responses with data from the World Bank and other academic studies on the topic. [More on methodology below]
The study revealed that USA comes in 16th place, with an average delusion of 22.67 percent, an average delusion of 39 percent for clothes that people think they wore during a year, an average delusion of 9 percent for food waste, and 20 percent for relocation. Overall, Russia was the country with the lowest level of delusion, with 3.33 percent, and Switzerland had the highest, with 26.33 percent.
The full study allows the responses to be filtered based on these categories for a more in-depth exploration of the findings. You can find the original tables here, on Movinga’s website.

Table from Movinga
More results: What we don’t use after moving, and what we think we don’t use.
Further findings include:
Belgium has the highest delusion percentage for clothing at 62% (they thought they hadn’t worn 26% of their wardrobe in the last year but they actually hadn’t worn 88%), and Russia has the lowest at 6% (47%; 53%).
Switzerland has the highest delusion for grocery shopping waste at 13% (they thought they wasted 5% of food bought but they actually wasted 18%), and Denmark has the lowest, with a negative delusion of -6% (they thought they wasted 10% but only wasted 4%).
The UK has the highest level of delusion when it came to belongings in use after moving at 21% (they thought10%, the reality was 31%), and Sweden has the lowest at 0% (they thought 12%, and they were correct.)
The USA has the highest levels of actual food waste with 24% of their weekly shop going to waste each week, the highest levels of unused belongings (35%), and the second highest percentage of unworn clothes (82%)
The final results of the full study can be seen here.
The full table
Methodology
To conduct this study, 18,000 heads of households in 20 countries were polled with the following questions:
- What percentage of your wardrobe hasn’t been worn in the last 12 months?
- What percentage of your grocery shopping ends up as waste?
- Since your most recent move, what percentage of your transferred belongings are still not in use?
1,000 in the USA | 2,000 in Germany | 2,000 in France | 1,500 in Sweden | other Countries in the study, between 500 and 800 participants — we polled only head of households from 22 to 60 years old — margin of error is +/- 5 percent.
Photo by Wjablow on Wikimedia Commons
What’s in your closet? Probably a lot more than was photographed here.
Afterwards, the results were compared with the data from specialists in the field of waste and hoarding. Interviewing 20 families comprising of two adults and two children as well as 10 single households about their behaviour regarding the topic of wasting and hoarding.
For the clothing, they took an inventory of the participants’ closet; then follow the daily use during a period of 12 months to record how many things in the wardrobe they didn’t use at all during the past year.
In terms of how much food people throw away, the participants were asked to keep track of their wasting habits during a period of six months – in doing so, they had to take into account grocery shoppings that went directly to the bin as well as leftovers.
The unused stuff was determined in an one-time interview where the interviewer took a tour through the participant’s house (including the attic and basement). Together, they counted the things which hadn’t been used in the last 12 months with the exception of pieces of art and other decoration which is for display only.
Comparing these two datasets allowed to calculate a margin of delusion for the three fields of clothing, food and stuff. On this basis, the participants’ home countries can be ranked according to their rate of delusion.
Source: Discard Studies Compendium: The Discard Studies Compendium is a project by Max Liboiron, Michele Acuto, and Robin Nagle.
Pingback: From Now Till Darien's First Day of School, Events for Teachers and New Students - DarieniteDarienite
Pingback: Darien Police Advice to Teens, Parents on Driving to and from School — Safely - DarieniteDarienite
Pingback: How to Protect Your Children's Privacy as They Head Back to School - DarieniteDarienite
Pingback: CT Sales Tax Free Week Coming Aug 19 to 25: What to Know - DarieniteDarienite
Pingback: Get Your Kids Involved in Back-to-School Shopping: Some Teachable-Moment Tips - DarieniteDarienite